The Bull Flag pattern is a popular technical analysis pattern used by traders in financial markets. It is a continuation pattern that indicates a temporary pause in an uptrend before the price continues to move higher. By understanding the characteristics of the Bull Flag pattern and how to identify it, traders can potentially take advantage of bullish opportunities in the market. In this article, we will explore the Bull Flag pattern in detail and discuss strategies for analyzing breakouts and managing risk.
Key Takeaways
- The Bull Flag pattern is a continuation pattern that signals a temporary pause in an uptrend.
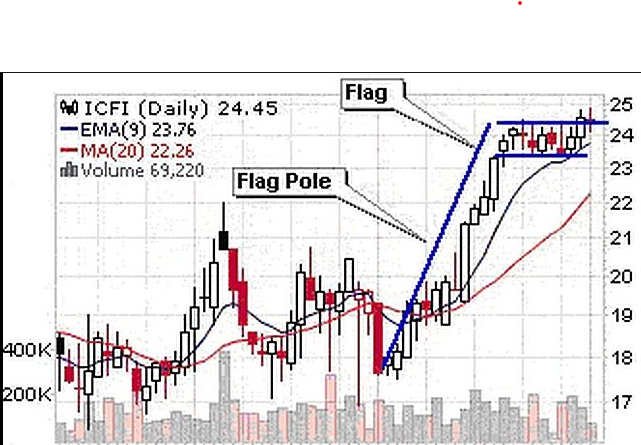
- Characteristics of a Bull Flag pattern include a sharp price increase (flagpole) followed by a consolidation period (flag).
- Traders can identify Bull Flag patterns by looking for parallel trendlines that form the flag and flagpole.
- Signs of a Bull Flag breakout include a strong volume increase and a break above the upper trendline of the flag.
- To confirm a Bull Flag breakout, traders can use additional technical indicators such as moving averages or oscillators.
Understanding the Bull Flag Pattern
Definition of the Bull Flag Pattern
The bull flag pattern is a technical analysis chart pattern that is commonly seen in financial markets. It is considered a continuation pattern, indicating a temporary pause in an uptrend before the price resumes its upward movement. The pattern is characterized by a flagpole, which represents the initial sharp price increase, followed by a flag, which is a period of consolidation. The flag is formed by a series of lower highs and higher lows, creating a narrowing price range. Traders often look for a breakout above the upper trendline of the flag as a signal to enter a long position, expecting the price to continue its upward trend. However, it is important to note that the bull flag pattern is not always a reliable indicator and should be used in conjunction with other technical analysis tools for confirmation.
Characteristics of the Bull Flag Pattern
The Bull Flag pattern is a continuation pattern that typically occurs after a strong upward price movement. It is characterized by a brief consolidation period, represented by a flag formation, followed by a resumption of the upward trend. Some key characteristics of the Bull Flag pattern include:
- Tight consolidation: The flag formation is usually a small rectangular shape that is bound by parallel trendlines. This indicates a temporary pause in the price action.
- Volume contraction: During the consolidation phase, trading volume tends to decrease, reflecting a decrease in market activity.
- Slope of the flagpole: The flagpole, which represents the initial strong price move, should have a relatively steep slope, indicating a strong buying pressure.
These characteristics help traders identify and interpret Bull Flag patterns, providing valuable insights for potential trading opportunities.
Identifying Bull Flag Patterns
Identifying Bull Flag Patterns is crucial for traders looking to capitalize on potential bullish trends. There are several key indicators to watch for when identifying these patterns:
- Price Consolidation: Bull Flag Patterns are characterized by a period of consolidation after a strong upward move, forming a flag-like shape.
- Declining Volume: During the consolidation phase, trading volume tends to decline, indicating a temporary pause in market activity.
- Flagpole Length: The length of the preceding flagpole can provide insights into the potential magnitude of the subsequent breakout.
By carefully observing these indicators, traders can enhance their ability to identify Bull Flag Patterns and make informed trading decisions. The following table summarizes the key characteristics of Bull Flag Patterns:
| Characteristic | Description |
|---|---|
| Shape | Flag-like shape formed after an upward move |
| Volume | Declines during the consolidation phase |
| Flagpole Length | Provides insights into potential breakout magnitude |
With a solid understanding of the identification process, traders can effectively incorporate Bull Flag Patterns into their trading strategies and increase their chances of success.
Analyzing Bull Flag Breakouts

Signs of Bull Flag Breakouts
When analyzing bull flag breakouts, there are several signs that traders can look for to identify potential opportunities. These signs include:
- Increasing Volume: A breakout accompanied by higher trading volume is often seen as a strong signal of a bullish continuation.
- Tight Consolidation: The flag portion of the pattern should exhibit a tight consolidation, indicating a period of indecision before the breakout.
- Price Breakout: The breakout should occur above the upper trendline of the flag pattern, confirming the resumption of the uptrend.
To further analyze the effectiveness of bull flag breakouts, it is important to consider confirmation signals and develop appropriate trading strategies. By understanding these signs, traders can enhance their ability to identify and capitalize on bull flag breakouts.
Confirmation of Bull Flag Breakouts
Confirmation of bull flag breakouts is crucial to ensure the validity of the pattern and increase the probability of a successful trade. Traders can look for several signs that indicate a breakout is likely to occur. These signs include an increase in volume, a break above the flag resistance line, and a strong bullish candlestick pattern. Additionally, technical indicators such as the Relative Strength Index (RSI) and Moving Averages can provide further confirmation. It is important to note that confirmation should not be solely based on one indicator, but rather a combination of multiple indicators. By confirming the breakout, traders can make more informed decisions and reduce the risk of false breakouts. Here is a table summarizing the signs of bull flag breakouts:
| Signs of Bull Flag Breakouts |
|---|
| Increase in volume |
| Break above resistance line |
| Strong bullish candlestick |
In conclusion, confirmation of bull flag breakouts is a critical step in successful trading. By utilizing various indicators and observing key signs, traders can increase their chances of profiting from this pattern.
Trading Strategies for Bull Flag Breakouts
When it comes to trading bull flag breakouts, there are several strategies that traders can employ to maximize their potential profits. One strategy is to wait for the breakout to occur and then enter a long position as soon as the price breaks above the upper resistance line of the bull flag pattern. This strategy takes advantage of the momentum created by the breakout and aims to capture the upward movement in price. Another strategy is to place a buy order slightly above the upper resistance line, anticipating the breakout. This allows traders to enter the trade early and potentially benefit from a larger price move. Additionally, traders can use technical indicators such as moving averages or volume analysis to confirm the strength of the breakout before entering a trade. It is important to note that while bull flag breakouts can offer significant profit opportunities, they also carry risks. Traders should always manage their risk by setting stop loss orders and determining profit targets based on their risk tolerance and trading strategy.
Managing Risk in Bull Flag Trading

Setting Stop Loss Orders
Setting stop loss orders is a crucial step in managing risk when trading the bull flag pattern. A stop loss order is an instruction to sell a security if it reaches a certain price, helping to limit potential losses. Traders can determine the appropriate level for their stop loss orders by considering factors such as the recent price action, support levels, and their risk tolerance. By setting stop loss orders, traders can protect their capital and minimize the impact of unfavorable price movements. It is important to regularly review and adjust stop loss orders as the market conditions change.
Determining Profit Targets
When trading using the bull flag pattern, it is important to have a clear strategy for determining profit targets. One common approach is to measure the height of the flagpole, which is the distance between the start of the uptrend and the high point of the flag. Traders often project this distance from the breakout point to estimate a potential target for the price move. Additionally, Fibonacci retracement levels can be used as reference points for profit targets. These levels are based on mathematical ratios and are commonly used by traders to identify areas of potential support or resistance. It is important to note that profit targets should be set based on individual risk tolerance and market conditions. Traders should always consider taking partial profits at key levels and adjust their targets as the trade progresses. By having a well-defined profit target strategy, traders can effectively manage their risk and maximize their potential gains.
Risk Management Techniques
In order to effectively manage risk when trading the Bull Flag pattern, several techniques can be employed. Setting stop loss orders is a crucial step to limit potential losses and protect capital. Traders can determine the level at which they are willing to exit a trade if the price moves against them. Additionally, determining profit targets is important to secure gains. By identifying a specific price level or percentage increase at which to sell, traders can lock in profits and avoid potential reversals. Lastly, implementing risk management techniques such as position sizing and diversification can help mitigate overall portfolio risk. These techniques involve allocating a specific portion of capital to each trade and spreading investments across different assets or markets. By employing these risk management techniques, traders can enhance their chances of success when trading the Bull Flag pattern.
Conclusion

Summary of Bull Flag Pattern
The bull flag pattern is a commonly observed technical analysis pattern in financial markets. It is characterized by a brief consolidation phase, represented by a flag-like structure, following a strong upward price movement, known as the flagpole. The pattern indicates a temporary pause in the market trend before the continuation of the bullish move. Traders often look for specific characteristics, such as a parallel flag channel and decreasing volume, to identify bull flag patterns. Successful identification and analysis of bull flag patterns can provide valuable insights for traders as they can indicate potential opportunities for profitable trades. However, it is important to note that the bull flag pattern is not foolproof and can sometimes result in false signals. Therefore, traders should exercise caution and use additional confirmation indicators before making trading decisions. To effectively trade bull flag patterns, it is crucial to understand the signs of bull flag breakouts, confirm the breakout with increased volume and price movement, and implement appropriate risk management techniques.
Benefits and Limitations of Bull Flag Trading
Bull flag trading offers several benefits and limitations that traders should consider. Benefits of bull flag trading include the potential for high returns and the ability to capture strong upward trends. This pattern can also provide clear entry and exit points, making it easier for traders to manage their positions. However, there are also limitations to be aware of. Bull flag patterns may not always result in a breakout, and false breakouts can lead to losses. Additionally, identifying bull flag patterns requires skill and experience. Traders should carefully analyze market conditions and use risk management techniques to mitigate potential risks. Overall, bull flag trading can be a valuable strategy when used effectively, but it is important to understand its limitations and implement proper risk management.
Final Thoughts
In conclusion, the Bull Flag Pattern is a powerful tool for traders in financial markets. By understanding its definition and characteristics, identifying bull flag patterns becomes easier. Analyzing bull flag breakouts and confirming them through signs is crucial for successful trading. Traders can employ various strategies to capitalize on bull flag breakouts. However, it is equally important to manage risk effectively by setting stop loss orders, determining profit targets, and implementing risk management techniques. While the bull flag pattern offers numerous benefits, it also has limitations. Traders should carefully consider these factors before incorporating bull flag trading into their strategies. Overall, the bull flag pattern provides traders with valuable insights and opportunities in the dynamic world of financial markets.
Frequently Asked Questions
What is the Bull Flag pattern?
The Bull Flag pattern is a bullish continuation pattern that occurs during an uptrend in financial markets. It is characterized by a brief period of consolidation, represented by a small rectangular flag, followed by a breakout to the upside.
How do you identify Bull Flag patterns?
To identify Bull Flag patterns, look for a strong uptrend followed by a period of consolidation where the price forms a small rectangular flag shape. The flag should slope against the trend and have lower volume during the consolidation phase.
What are the characteristics of the Bull Flag pattern?
The Bull Flag pattern has several key characteristics. It is a continuation pattern that occurs during an uptrend, it represents a brief period of consolidation, and it is typically followed by a breakout to the upside.
What are the signs of Bull Flag breakouts?
Signs of Bull Flag breakouts include a significant increase in volume during the breakout, a strong move to the upside, and a confirmation of the breakout through technical indicators such as moving averages or trendlines.
How can I confirm a Bull Flag breakout?
You can confirm a Bull Flag breakout by looking for a significant increase in volume during the breakout, a strong move to the upside, and a confirmation of the breakout through technical indicators such as moving averages or trendlines.
What are some trading strategies for Bull Flag breakouts?
Some trading strategies for Bull Flag breakouts include entering a long position when the price breaks above the flag pattern, placing a stop loss order below the flag pattern, and setting a profit target based on the height of the flagpole.